Advanced Track
SQL Reporting in MS SQL Server
Learn how to uncover data-based insights with SQL reporting. Write real-world SQL queries that apply to real-world business situations.
4.77
3,164 Lerners enrolled
Free trial Yes
Certificate of completion Yes
Estimated time 28 h
Courses included 3
Skills you will gain
- Prepare detailed reports with SQL.
- Organize long and complex SQL queries.
- Use popular SQL aggregate functions like COUNT() and SUM() to summarize data.
- Build multilevel aggregations with GROUP BY and nested WITH queries.
- Create custom classifications with CASE WHEN.
- Filter and compare revenue data in SQL reports.
- Combine multiple metrics in a single report.
Last reviews
Description
This learning path is for people who want to move from writing simple SQL queries to creating complex, multilevel reports in SQL. You’ll learn how to analyze, filter, and compare data – unearthing insights you can use to boost your market position. Scroll down for details.
Are you a data analyst? Or maybe you’re a marketer, accountant, or business owner? To be effective, you need to draw proper conclusions from your data. Our SQL Reporting learning path will give you the necessary skills to uncover data-backed insights and make better strategic decisions for your business.
First, you will practice building complex SQL reports. You’ll learn about the nuances of GROUP BY, how to build custom classifications with CASE WHEN, and how to combine these statements to prepare statistics, compute multilevel aggregations, and generate customized reports.
Next, you’ll tackle revenue trend analysis in SQL. You’ll learn how to create time-period and history-to-date revenue reports. You’ll practice creating year-to-year, quarter-to-quarter, and month-to-month revenue reports and computing the revenue difference (delta) between years, quarters, and months.
Finally, you’ll learn how to analyze the customer life cycle. How can you effectively choose acquisition mechanisms that create sales and profit? How can you learn more about conversion and churn? We’ll show you the way to answer such questions with SQL.
Everything in this course is based on real-life examples and business scenarios. After completing the SQL Reporting track, you’ll be able to follow market trends, develop sales strategies, and present financial results. The abilities you acquire can be applied to any industry. They’ll give you an advantage over the competition, allowing you to grow your business or move to a higher level in your career.
What's in it for me?
- Well-defined learning path that includes 2 fully interactive courses. Learn to write SQL queries, the backbone of data-driven business reports.
- Learn by doing. Get hands-on practice with our real code editor, real data sets, and real-life problem-solving.
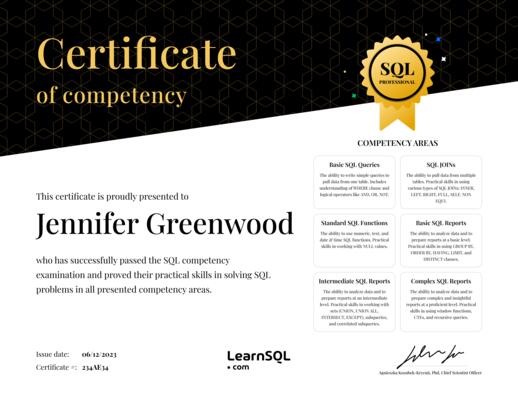
- Online certification. After successfully completing the course, you will receive a certificate that you can publish on your LinkedIn profile.
- Trusted support system. Every course comes with access to our resource base, student2student support, mentor2student support, and technical support. You can also join our learning community and participate in on-task discussions.
- Hints and more. If you get stuck, you can use the included exercise hints. Or use the Discuss tab to ask questions and share insights with other members of the LearnSQL community. You can also drop us a line at contact@learnsql.com and we'll be more than happy to help!
Objectives:
- Prepare detailed reports with SQL.
- Organize long and complex SQL queries.
- Use popular SQL aggregate functions like COUNT() and SUM() to summarize data.
- Build multilevel aggregations with GROUP BY and nested WITH queries.
- Create custom classifications with CASE WHEN.
- Filter and compare revenue data in SQL reports.
- Combine multiple metrics in a single report.
Who should take this learning path?
- People who need to prepare complex SQL reports.
- Entrepreneurs and business owners.
- People who want to use SQL to analyze customer behavior and revenue trends.
- Anyone looking to make strategic decisions based on data analytics.
Requirements:
- A web browser
- An internet connection
- Basic knowledge of SQL (e.g. you’ve completed our SQL Basics course)

Track courses
-
Creating Basic SQL Reports in SQL Server97 Coding challenges Advanced
Learn how to build basic SQL reports and make more informed, strategic decisions.
-
Revenue Trend Analysis in SQL Server59 Coding challenges Advanced
Learn how to perform trend analysis in SQL Server, and create a meaningful revenue report from square one.
-
Customer Behavior Analysis in SQL Server73 Coding challenges Advanced
Learn how to conduct an analysis of customer behavior for your business using T-SQL queries. In this online course, you'll find out how to measure the acquisition, conversion, sales, and churn using SQL Server.

Get the Certificate of Competency in SQL
This certificate will confirm your practical SQL problem-solving skills
