Advanced Course
Revenue Trend Analysis in PostgreSQL
Learn how to analyze revenue trends and create reports using PostgreSQL. Discover how to build meaningful revenue reports and do deep analysis, all from scratch!
5.00
240 learners enrolled
Free trial Yes
Certificate of completion Yes
Time to complete 10 h
Coding challenges 59
Skills you will gain
- Compute the overall revenue of your company.
- Calculate the revenue generated for a given timeframe.
- Obtain the year-to-date and month-to-date revenue amounts.
- Compare revenue across different time frames and categories.
- Create a clear and concise revenue report in PostgreSQL.
Last reviews
Description
Analyzing financial performance is crucial for every company as it provides valuable insights into its success. One way to do this is by looking at revenue trends. While many tools like Excel spreadsheets are available, using SQL is the best option if your business data is stored in a database. SQL lets you harness the power of your database through advanced queries on your data to generate revenue reports efficiently.
In this online course, you learn how to use the PostgreSQL database to analyze revenue trends. You query the database of a fictional online grocery store, working with data about customers, products, employees, and orders. You gain skills for creating various reports in SQL for analyzing trends: computing the total number of events, creating year-to-year, month-to-month, or quarter-to-quarter reports, computing the change between two different time periods, etc.

When you complete this PostgreSQL online course, you'll be able to gain similar insights about trends from data in other parts of your business, for example, website traffic over time, social media engagement, customer behavior analysis, inventory management, etc. Since every business has data about customers, products, and sales, we have selected an online store database as the course dataset. It is easy to modify the examples in this course to your business scenario.
This PostgreSQL online course is intended for users who know basic SQL concepts: how to use WHERE, GROUP BY, ORDER BY, and HAVING clauses, and how to join tables, among others. We introduce these concepts in our course, SQL Basics in PostgreSQL. If you are not familiar with these concepts, we recommend starting with those basics and returning to this course later.
This course is ideal for analysts, data science beginners, IT students, and anyone looking to work with data and generate reports. When you complete it, you will have the skills to create a wide range of revenue reports in PostgreSQL.
Like all our courses, it is interactive. You practice writing real SQL queries to solve exercises on your web browser. Our web-based platform runs your command and verifies your solution. You do not need to install anything on your device. This means you start practicing right away.
What's in It for Me?
- 59 interactive exercises. Learn at your own pace, from any location, and at any time. By completing practical exercises, you reinforce and remember what you have learned so far.
- Lifetime access to the course. When you purchase the online course, you gain lifetime access to its content. You can access the course materials and benefit from them instantly and indefinitely.
- Online certificate. When you successfully finish all the exercises in the online course, you receive a downloadable PDF certificate to showcase your accomplishment.
- 30-day money-back guarantee. If you're not satisfied with the quality of the online course, you can get a refund within 30 days of your purchase.
- Exercise hints. You may access pre-made hints for each exercise or actively engage with our community by asking questions and sharing insights through the Discuss tab.
What Do You Need to Take This Course?
- Internet connection and a web browser.
- Basic knowledge of SQL as presented in our course SQL Basics in PostgreSQL, or equivalent.
Learn How To:
- Compute the overall revenue of your company.
- Calculate the revenue generated for a given timeframe.
- Obtain the year-to-date and month-to-date revenue amounts.
- Compare revenue across different time frames and categories.
- Create a clear and concise revenue report in PostgreSQL.
Who Should Take This Course?
- Analysts who know the fundamentals of SQL and want to use it for reporting revenue with PostgreSQL.
- Business analysts who wish to work with PostgreSQL.
- Entrepreneurs who want to optimize their businesses.
- Professionals working in sales and marketing using PostgreSQL databases.
- Aspiring data scientists.
- Anyone with a theoretical understanding of basic SQL who wants to use it in practice.
- You!

Table of contents
Course progress 0%
Exercises completed 0/59
-
Computing total revenue for different time periods
0/18Get to know the data model and learn some basic revenue trend concepts.
-
Comparing revenue across different periods
0/22Learn how to compare revenue values from different periods.
-
Comparing revenue over time across different categories
0/19Learn how you can extend the report types you already know by comparing different product categories.

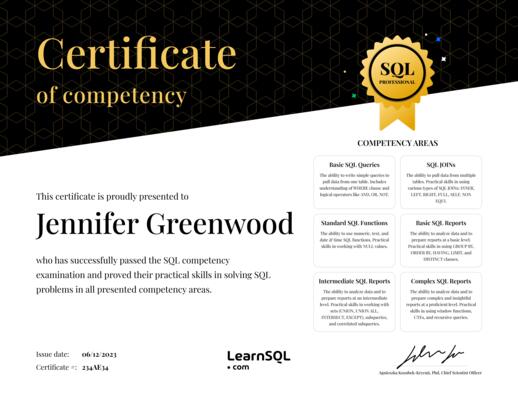
Get the Certificate of Competency in SQL
This certificate will confirm your practical SQL problem-solving skills
